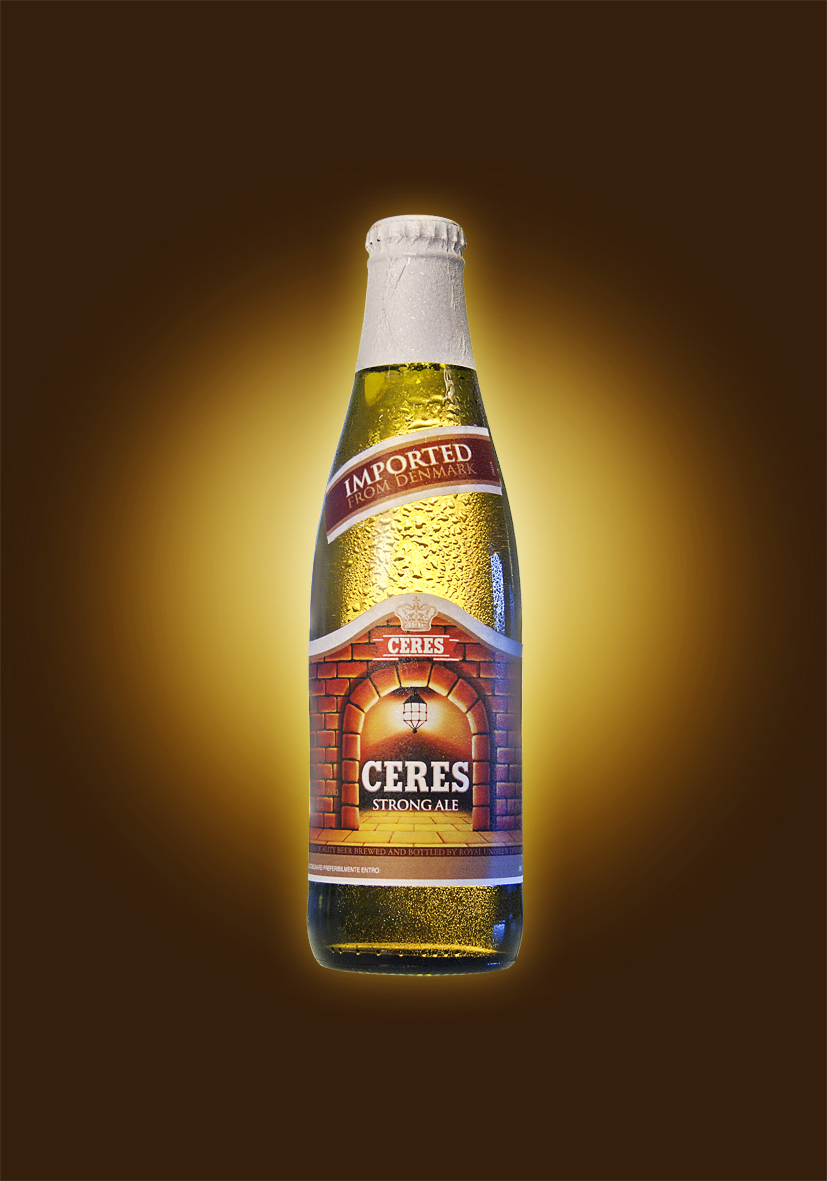
Ceres Campaign Performance Data Model
That time that Nielsen asked for our data model
When our campaigns perform neatly, we love to know exactly how neatly they do.
Client
- Ceres
Year
2010
Industry
- Food & Beverage
Partner
Duri Bardola
Category
Brand Strategy
Tag
Brand Design, Brand Experience, Communication Strategy, Data Analysis,
We mostly do it because that is the best data we can collect to prepare for what comes next. It is a learning key-time and a way for us to spread culture in the office and with our clients.
Keeping track of our results during a long journey with CERES beer has been the most amazing challenge: almost 18 years of continuous advertising, strategy consultancy, ATL and BTL curation needed a very precise measurement of their efficacy.
Plus: they needed a clear and compact graphical representation for anyone to understand how the brand was performing, even for those who have little literacy in marketing research and marketing data mining.
Our Master Partner Bruno Buzzo, formerly CEO at PBCOM Brand Engine and Professor of Business Communication at the Economy Department of Genoa University for more than 20 years, designed a few matrixes where CERES beer’s advertising performance was clear in terms of both association and recall if compared to its competitors on the market. Besides the Ceres brand wonderful long term results, of which he’s surely proud of, he clearly remembers the day when he picked up a phone call from an account at Nielsen, who asked him if the company could use his matrixes as a model for their tracking studies results deliveries. “That should normally work the other way around!”, he said, “But it’s nice how pioneering can have so many shapes in our industry”. The authorization to Nielsen was given by Bruno.